Herbie Alt Statistics
In previous posts, we looked at Herbie’s regime testing capabilities by devising an oracle which would give us the best possible regime splitting, and then came up with several metrics to look at how well Herbie does. We will now extend that testing to alts. All tests were done on the alt-testing branch of Herbie.
When we talk about alts, we are referring to an internal representation of a possible “alternative” way of representing Herbie’s input equation. For example, the input \(1/(1/x)\) may have the alt, \(x\). The alt table will refer to a table containing all possible alts that Herbie is currently considering. Alt picking refers to the process of picking a specific alt from the alt table for Herbie to try to further improve. An alt is marked done if the picking function has previously picked it. An alt is in the set of “fresh” alts if it has not been marked done.
Number of Alts in the Alt Table
One piece of information that will be useful in deciding what parts of Herbie to improve is data about how many alts are in the alt table at each improvement iteration. Collecting this data will allow us to assess how much of a performance impact trying every alt in the alt table would have, as well as provide us general information on what Herbie is actually doing internally. Below is a table summarizing the results. Iter 0 refers to the alt table after iteration “0” (before an improvement iteration has been run, but after a potential initial simplify.)
| Iter 0 | Iter 1 | Iter 2 | Iter 3 | |
|---|---|---|---|---|
| Mean | 1.22 | 7.21 | 8.80 | 9.32 |
| Std Dev | 0.41 | 3.83 | 4.21 | 4.54 |
| Max | 2 | 20 | 21 | 30 |
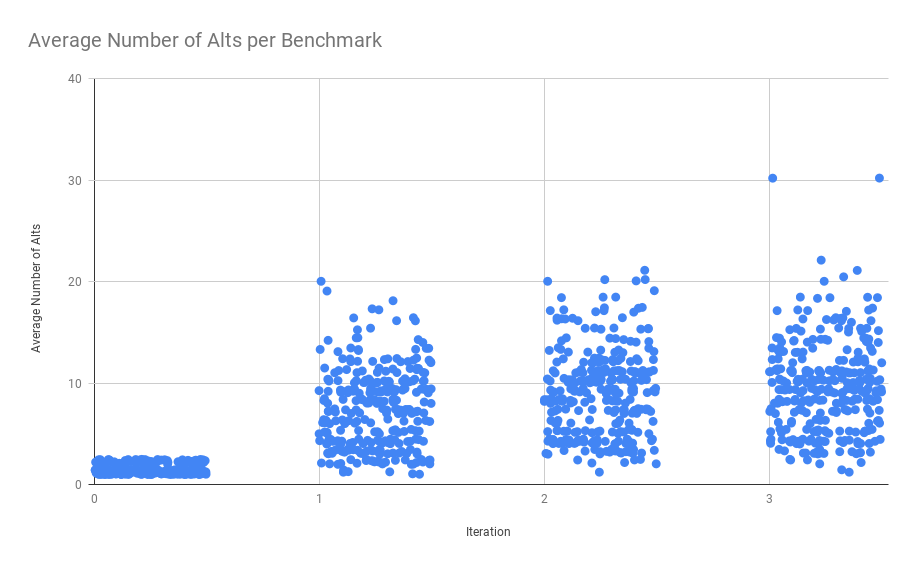
And here is a graph of those same results. Each point corresponds to a Herbie benchmark with random x-axis jitter thrown in to better see the trends.

From the table and graph we can see that almost all alts are generated from our initial iteration, with fewer alts being kept from each further iteration. Herbie only keeps an alt in the alt table if it is better than any other alt on at least one sampled point, so it seems like Herbie does a really good job with its initial simplify, and we then try each alt in that initial alt table we think could improve the output further. However, another possibility is that Herbie generates alts that are better than most of the previous alts on each iteration, and the old ones get thrown out from the alt table. If the latter is the case, then we might have a problem picking the wrong alt “tree” to try to improve.
For instance, consider the case that we have two alts \(A_1\) and \(B_1\) in the alt table with \(40\) and \(41\) bits of error respectively (lower is better). Herbie’s alt picking function will pick \(A_1\) which then might improve to \(A_2\) through \(A_n\) all with \(30\) bits of error. Herbie will then continue to pick some \(A_i\) for the rest of its improvement iterations, and will never try to improve \(B_1\). This is a problem because \(B_1\) might improve to and alt with only \(5\) bits of error, but because we never pick that one, we never get to see the better alt.
We theorized that something like this might be happening in the previous post where some regions of the input points didn’t have alts generated that Herbie was able to find when constrained only to that region.
Age of the Alt Table
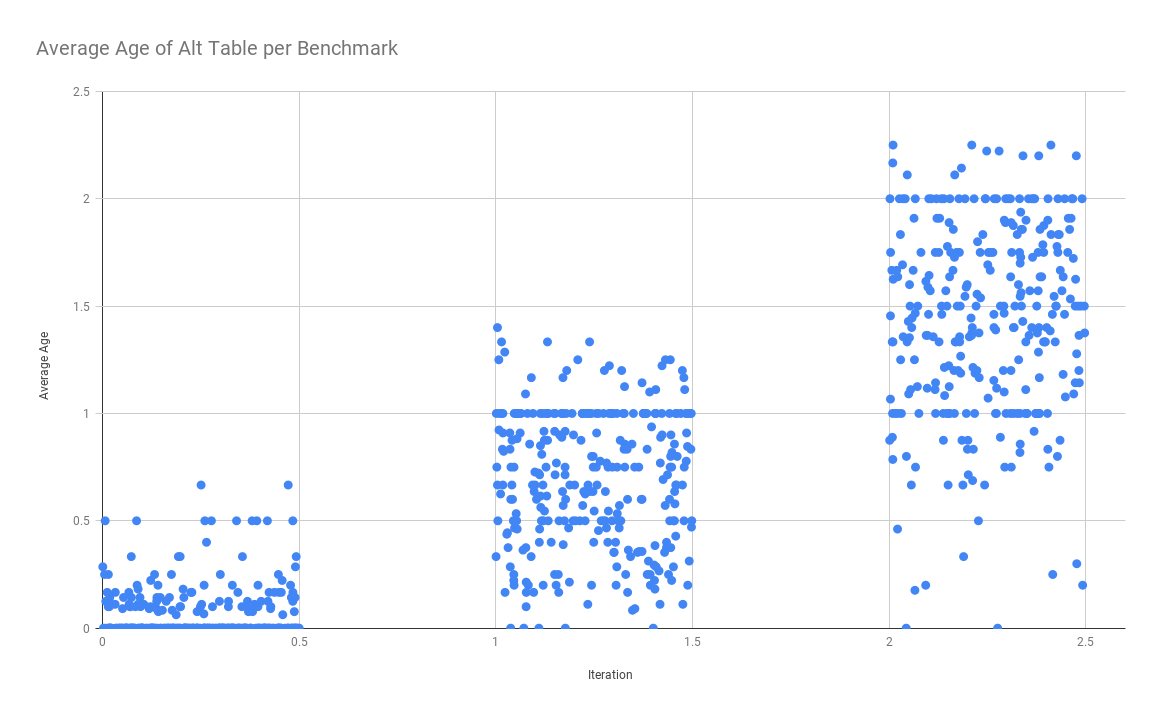
Luckily, there is an easy way to test which of these two possibilities is the case: namely we look at the age of alts in the alt table. We will define the age of an alt as the number of iterations it has been in the alt table, with all alts starting with age 0 when they are first added. So if an alt was added on the 1st iteration and we are looking at the alt table on the 3rd iteration, then that alt will have an age of 2. If the alt table has on average, an age close to the number of iterations \(- 1\), then we are keeping around the alts from our first iteration, and don’t have to worry about losing valuable alts that might have large improvements to be made. If the average age is close to 0, then we might be justified in our concern that we are picking the wrong alt tree to improve. Below is a scatter plot of the age of each benchmark at iterations 1, 2, and 3 (all alts at iteration 0 have 0 age) once again with x-axis jitter thrown in to see trends.

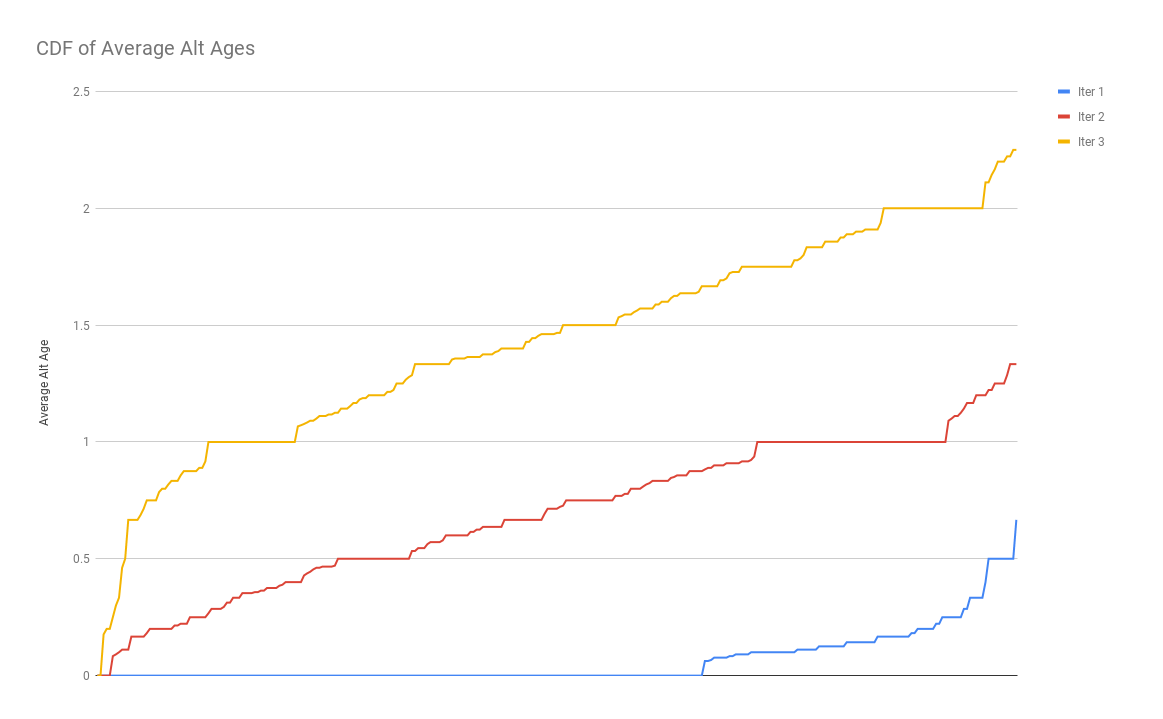
This graph is useful, but it’s hard to see the larger trend. In order to visualize what’s happening here better, we will sort the average age of the alt table at each iteration for every benchmark, and then draw a line chart connecting each point of data. Mathematically, this is a mirrored cdf-plot turned on its side, but intuitively, the relative width of each value just corresponds with the frequency of that value. We can see from this plot, that most often, we don’t have to worry about going down the wrong alt tree, and that Herbie generally will keep around most of the alts from the initial iteration. However, we do see that’s not always the case, so it still is a possibility in specific circumstances.

This graph makes the trend much more obvious and make clear our previous conclusion that Herbie mostly picks alts from the alt table generated from our first iteration.
Files
The full log file containing the data used to make this table can be found here.