Testing the Regime Functionality of Herbie
This post is part of an ongoing series about my Summer research on Herbie and floating point numbers.
One of the strategies that Herbie uses to reduce the error in floating point expressions is to split its output into different “regimes”. These regimes partition inputs into different sets that Herbie detects can be improved most by different expressions. For example, in this expression, Herbie splits the output into several different regimes, branching on different inequalities on \(t\). One interesting question that you can ask about Herbie that can give some insight as to a possible area of improvement is how well these regimes work. Herbie is able to branch on fairly complex expressions, as it does here branching on \((\sqrt[3]{y - z} \cdot \sqrt[3]{y - z}) \cdot \frac{\sqrt[3]{y - z}}{(t + 1.0) - z}\). However, Herbie is still limited currently by what expressions it can branch on, and by its inability to nest branch conditions (i.e. \(\texttt{if } x > 3 \texttt{ then } (\texttt{if } y > 2 \texttt{ then } x \texttt{ else } y) \texttt{ else } x - y\)).
To figure out if better regimes are something useful for further improving Herbie, I wanted to collect some statistics to see how good the current implementation of regimes is. To do this, we need a baseline to compare Herbie to, as well as some sort of optimal regime splitting. For the baseline, I decided to use the output of Herbie if there were no regimes used, i.e. there is no branch condition in Herbie’s output. This gives us a good baseline for regimes’ worst case. To get the best possible result that regimes can give I used an oracle. This oracle will take every intermediate expression generated in Herbie and save it for later. Then, when the output error is calculated, the oracle will try its input in each saved expression and use the best result. Thus, our oracle acts as if it has partitioned the inputs in the best possible way, giving us the optimal regime at each point.
Now that we have a scale, we can run it on all of Herbie’s benchmarks to see how well Herbie performs compared to the baseline and the oracle. Running all of the benchmarks gives us a cool graph which plots the percent Herbie improves against the span (baseline - oracle).
Note that the graph has been cut off to only show span greater than 1 and positive Herbie improvements. Herbie’s score will occasionally score less than the baseline output because Herbie trains it’s output based on an initial set of sampled points, but the error is calculated by a set of resampled points to offset the possibility of overfitting. Although Herbie’s output is determined based on the initial points, the baseline (no regimes) run is done based on the resampled points. Ideally, this would be done based on the initially sampled points, but the effects of having the baseline calculated based on the resampled points are very minimal. The maximum negative difference between Herbie’s output and the baseline is .3 bits of error, and most of them are at least an order of magnitude less than that. This is about what we would expect, because we haven’t seen Herbie have a problem with overfitting.
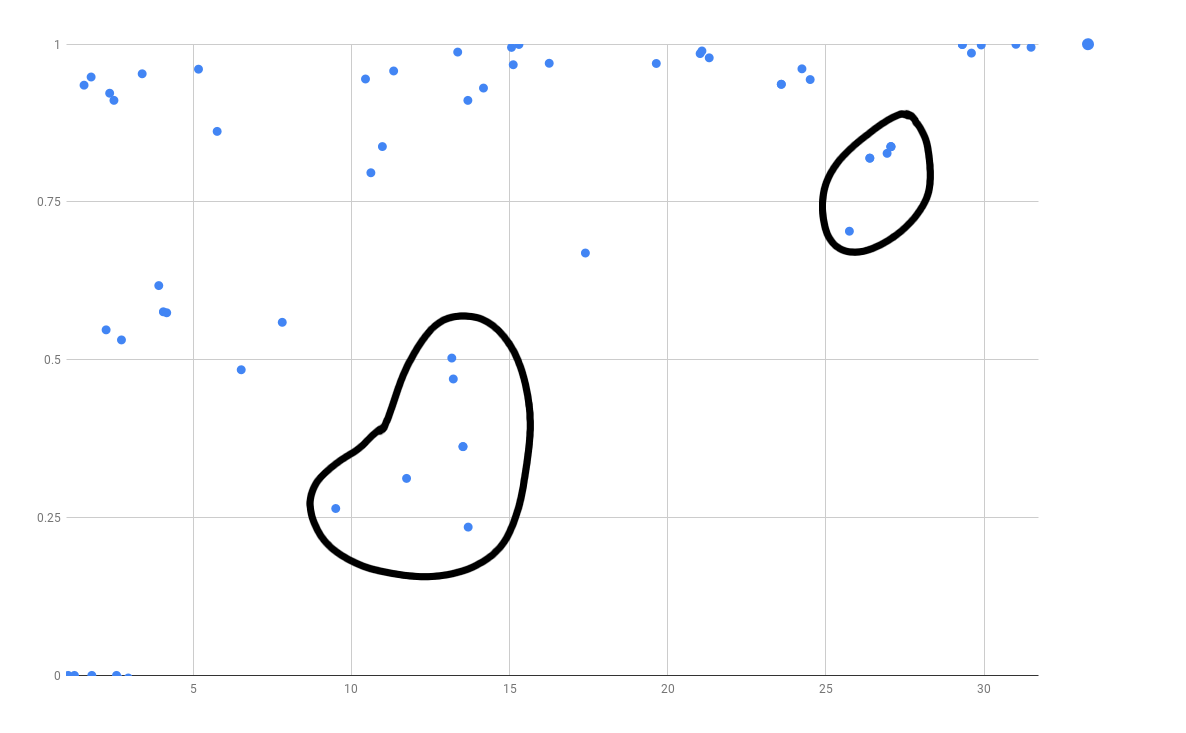
There are a few things that can be seen immediately with this graph, Herbie does a relatively good job of picking regimes, but there are definitely a few expressions where the oracle makes a significant improvement over Herbie. The circled points are examples of these. These are points where there is a difference of 5 or more bits of error between Herbie’s output and the oracle’s. These points are interesting because the optimal regimes give a significant improvement over what Herbie currently does, pointing to possible points of improvement. The average Herbie improvement on tests with a span greater than 1 is \(67.1\%\).
The Compound Interest Formula
One of the interesting expressions on this plot that is also easy to analyze is the compound interest formula. You can see Herbie’s output for this expression here. In this case, Herbie detects a large number of regimes based on a complex branch expression, so Herbie is able to tell that there are a lot of different areas of improvement for the graph. Here, Herbie’s regimes do a pretty good job of improving the bits of error, taking the result from \(28.33\) bits of error with no regimes, to just \(16.69\) bits. Despite Herbie’s large improvement though, the oracle still finds a significant amount of improvement to do, further reducing the bits of error to only \(10.93\). This seems like significant enough improvement to warrant further investigation.
One thing to look at when deciding if Herbie can make further improvement on the regime boundaries is to look at the best expression at each point, as in the following graph.
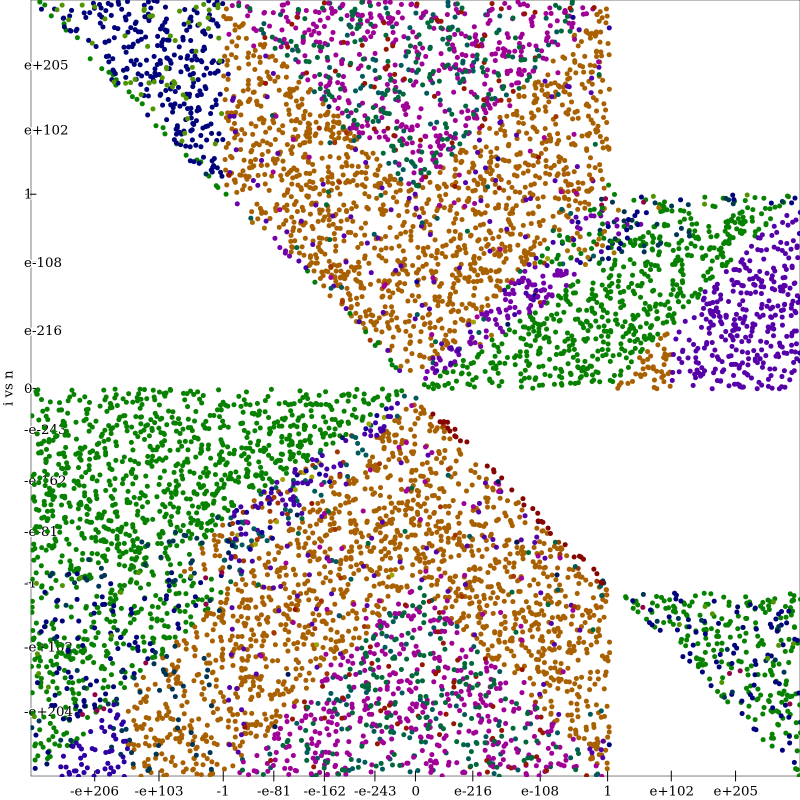
This graph plots each point that we sample on a log-log graph. Each color represents a different expression used in Herbie, and the color of each point represents the expression the oracle finds is best at that point. The areas of the graph that have no points are locations where the value of the expression is NaN or +/-inf. I will call this a regime plot. Looking at this plot, we can see that there there are pretty well-defined sections where one expression does best. However, many areas don’t have a single dominating expression, and instead have two or three. This seems like a good candidate that would benefit from regime improvement. Compared to the output of a relatively simple expression such as \(e^{a \cdot x} - 1\) (regime plot seen below), this is a very messy expression where its not clear the best split points for regimes.
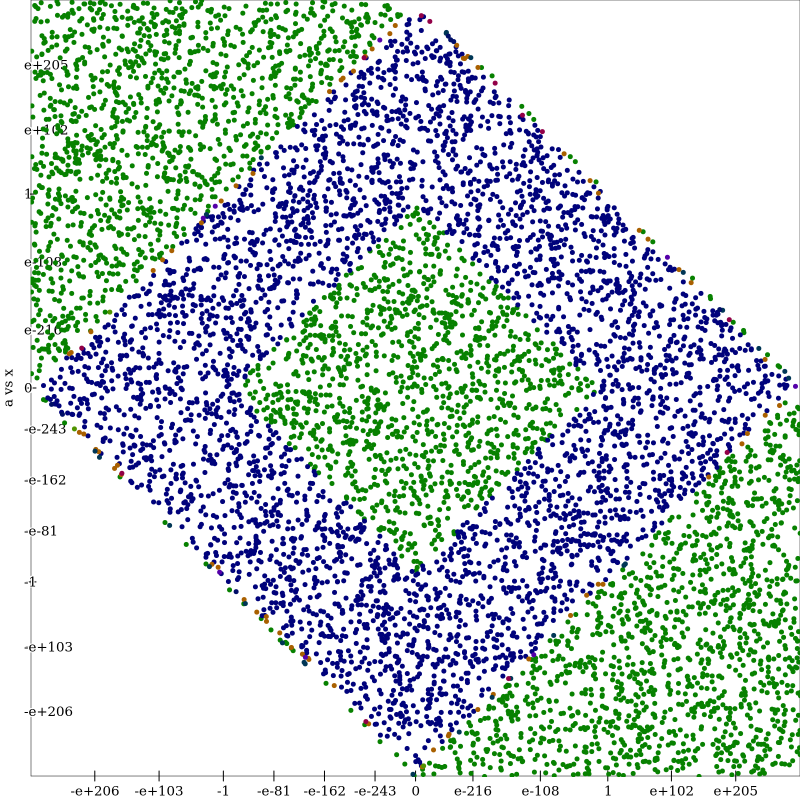
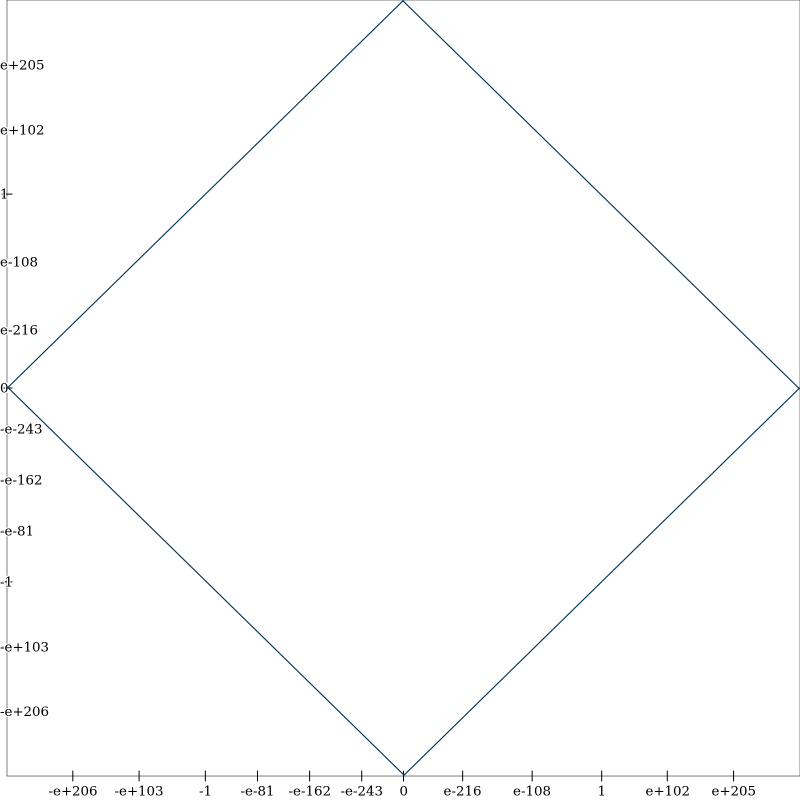
Looking at our simple example, it’s clear which regimes should be chosen, and Herbie does a pretty good job choosing the regimes, branching on \(a \cdot ((a \cdot x) \cdot (x \cdot \frac{1}{2}) + x) \leq 0.014\) (inside the figure graphed below.) However, Herbie doesn’t make the seemingly obvious choice to make two branch conditions, instead picking just one. This is because internally, Herbie requires that there be at least 1 bit of improvement to create another branch condition. Herbie is able to improve this expression from \(20.56\) bits of error, to just \(0.21\) bits of error. The oracle further improves this to \(0.05\) bits of error, but Herbie doesn’t branch again because there isn’t another bit of error to be improved.
Next Work
One problem with this visualization is that it’s not obvious how much better the displayed expressions are than other possibilities. Ideally, we would like to see not just the optimal expressions, but also how much better they are than those in our current regimes. This visualization also breaks down when dealing with more than 2 variables (each variable adds another dimension to the regime plot.) Another issue is we don’t know how much improvement we can realistically expect. We can’t just return our oracle for evaluating expressions since the oracle relies on MPFR to internally calculate the exact value of input points. We need to have some concrete function to return as Herbie’s output rather than this abstract concept of an oracle that only works on some points (or one uses non-floating point calculations internally.) One way we might imagine testing the upper limits of the capabilities of regimes is by using a machine learning algorithm to come up with the best bounds for partitioning these points such as an SVM.
Notes on the Oracle
Something to note about the oracle is that it doesn’t necessarily use the single best expression possible at each point, it only samples from expressions that Herbie generates. This isn’t too much of an issue because we are only testing Herbie’s regimes capability, so we don’t really care about which specific expressions are generated. This test can be thought of as taking a set of expressions and then running the baseline, Herbie’s regime inference, and the oracle on that set with a list of input points. Although the specific numbers of the test might change given a different set of expressions, I believe Herbie’s capabilities to be sufficient to give meaningful insight as to the capabilities of regimes in general, relative to an oracle and the baseline. This possibility that the input data we’re working with is something to keep in mind though, and might warrant further attention if significant changes are made to Herbie’s expression generation processes.