Herbie Regime Testing Update 2
This post is a continuation of my testing of Herbie’s regime functionality. In the previous post, we discussed some better graphs that allow us to look at the effectiveness of Herbie’s regime’s better by plotting how well each point does on a scale from no regimes to an oracle’s regimes. This time, we will take a closer look at the compound interest example.
Previously, we determined that for some expressions, Herbie’s regimes don’t do a very good job of picking the optimal partitioning of points. We now look specifically at one of those examples (the compound interest formula) to figure out some more information about the optimal splitting. One thing we might want to look at is if Herbie can detect these possible partitions and it just doesn’t, or if it lacks the capability to detect them in the first place. If we look at the compound interest regime percent improvement plot, we notice 3 sections which seem to have the largest room for improvement (circled below.) Herbie improves this expression from \(47.2\) bits of error on average to \(17.2\) bits of error with a span of \(17.40\) bits (the span is the oracle error minus the baseline regime error.)
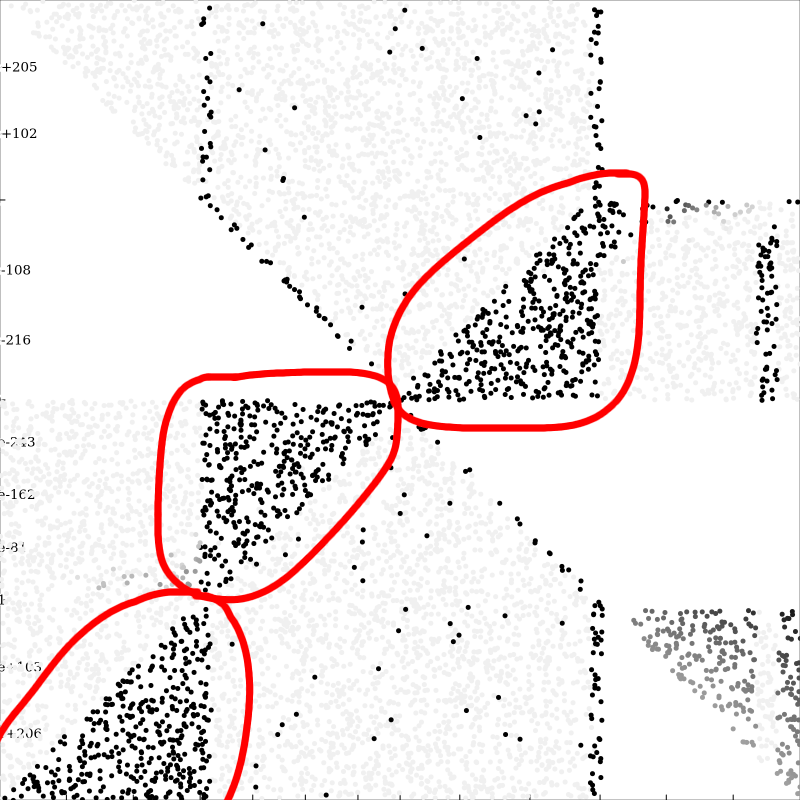
Now that we have identified 3 areas that Herbie doesn’t improve well with regimes, we can restrict Herbie to only look at one of those areas at a time to see if Herbie can find additional splitpoints, and see if Herbie produces any different results for this section individually compared to the combined test result. We will first restrict Herbie to the bottom-left circled triangle. It is easy to restrict Herbie to only work on this triangle by imposing a precondition. This is extra information specified in the FPCore for Herbie’s input and will restrict Herbie to only look at sections of the expression that satisfy the precondition. Our input FPCore then looks like
(FPCore (i n)
    :name "Compound Interest"
    :pre (and (<= (fabs (/ i n)) 1) (< i -1) (< n -1))
    (* 100 (/ (- (pow (+ 1 (/ i n)) n) 1) (/ i n))))
Herbie’s output expression for this triangle is
\[100 * \left (\frac{e^i}{i/n} - \frac{n}{i} \right )\]which gives us the regime percent improvement plot:
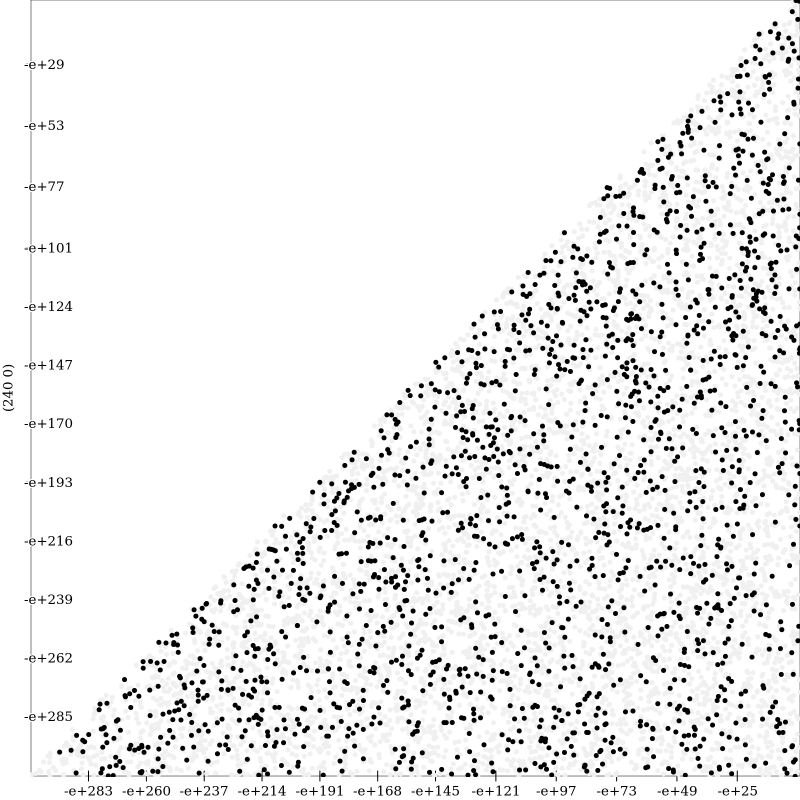
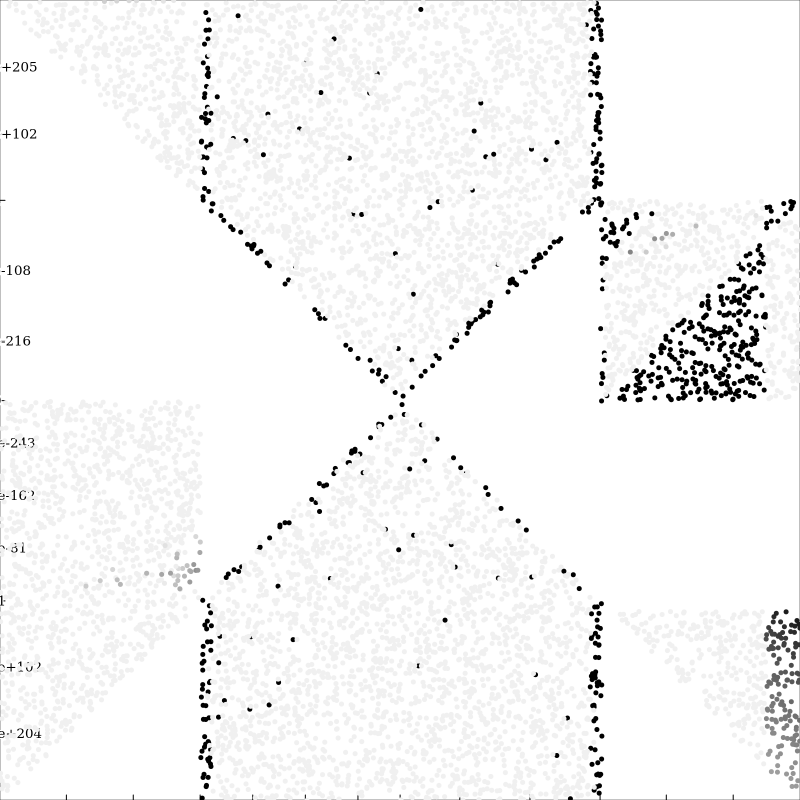
Herbie improves this area from \(56.1\) bits of error on average to \(0.3\) bits of error, with a span of \(0.232\) bits. Note that Herbie is able to improve this triangle much more when confined only to this region than when looking at the full range of inputs for the compound interest formula. Note that although there are several points where the regime percent improvement is very low (the dark black points,) the span is so small, and the overall error is so low, that these points aren’t of particular interest. The other triangle regime percent improvement plots are shown below.
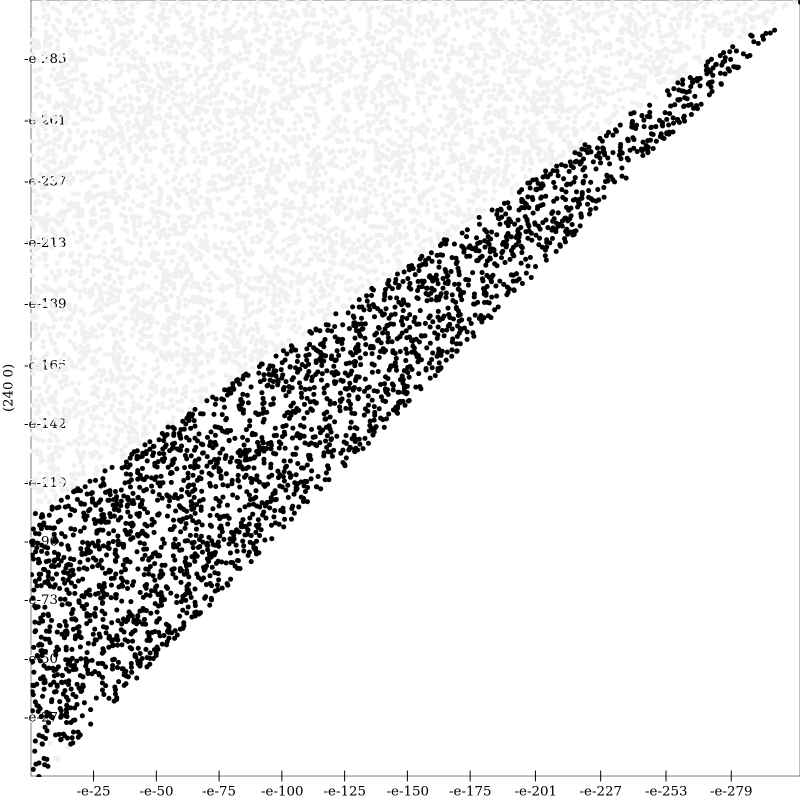 Regime Percent Improvement Center Left Triangle
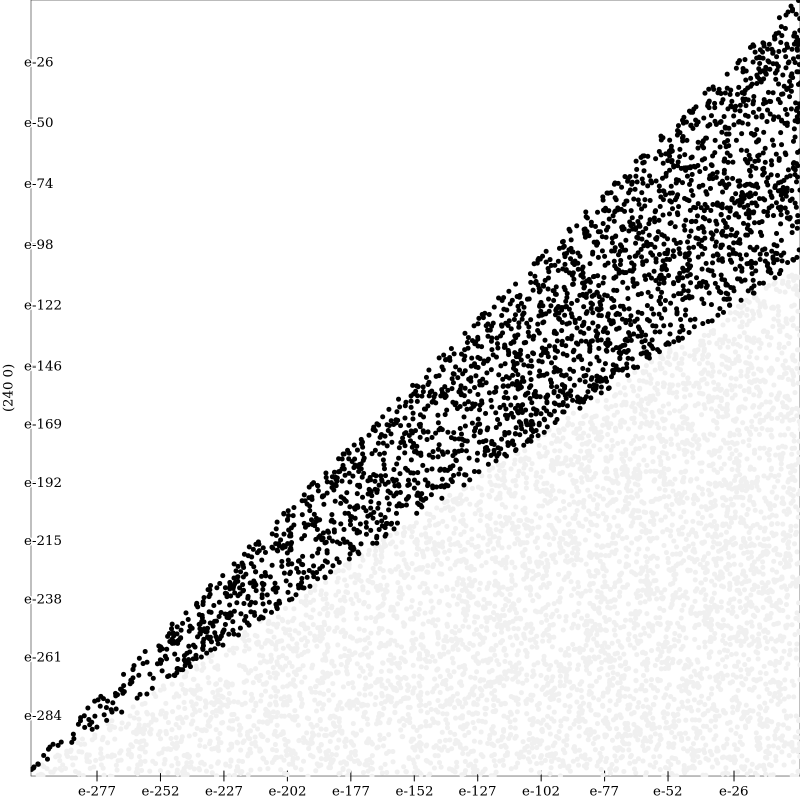 Regime Percent Improvement Center Right Triangle
One interesting thing to note is the distinct symmetry between the two plots. Despite this symmetry though, the two different sections produce different output expressions. These expressions are not included here because they are long and don’t provide any meaningful insight into what Herbie is trying to optimize, but they can be reproduced with the FPCore file included at the end of this post. Neither of these expressions are improved by Herbie: both remain at \(36.1\) bits of error. The span for the center left triangle is \(0.85\) bits and the span of the center right triangle is \(0.81\) bits. Note that although there is a clear partitioning of the space which gives a lower average error, Herbie doesn’t add a regime in its output. This could be because Herbie can’t find an expression to branch on, but more likely, Herbie just isn’t choosing to split here because internally, it requires 1 bit of average improvement total for the addition of a regime in order to add it. Here, the optimal regime splitting can’t give more than \(0.81\) bits of error improvement, so Herbie won’t branch on this even if it detects it as a possible regime.
Now that we know the best output expression for each of the sections we looked at, we can go back to Herbie’s initial run of the compound interest formula to see why these regimes aren’t being inferred, particularly for the bottom left triangle which gives a significant improvement. Interestingly, none of the resulting expressions from the individual triangle runs are generated at any step of Herbie’s run on the full range of inputs. Thus far, we have been looking exclusively at the regime inference functionality of Herbie. However, this result indicates that there may be further information to be gained from looking at how Herbie generates intermediate expressions. This will be the next aspect of Herbie that we look at.
Before we conclude this step in our investigation of Herbie’s regime functionality, we will construct a target for the compound interest formula which is a combination of the best runs for each area of the formula we looked at. The last thing we need before we combine these results is the best expression for the inputs not included in the triangles. We can do this by combining the preconditions from each of the triangle runs and then negating them. This gives us the following regime percent improvement plot:
Herbie gives us the output expression
\[\begin{array}{l} \mathbf{if}\;i \le -1.4562885009438895:\\ \;\;\;\;\frac{ {\left(\frac{\frac{-1}{n}}{\frac{-1}{i}}\right)}^{n} - 1}{\frac{i}{100 \cdot n}}\\ \mathbf{if}\;i \le 3059661.8928731075:\\ \;\;\;\;\left(100 \cdot \left(\sqrt[3]{1 + i \cdot \frac{1}{2}} \cdot \sqrt[3]{1 + i \cdot \frac{1}{2}}\right)\right) \cdot \left(\sqrt[3]{1 + i \cdot \frac{1}{2}} \cdot n\right)\\ \mathbf{if}\;i \le 1.7390641936359746 \cdot 10^{+254}:\\ \;\;\;\;100 \cdot \left(\frac{\sqrt[3]{ {\left(1 + \frac{i}{n}\right)}^{n} - 1} \cdot \sqrt[3]{ {\left(1 + \frac{i}{n}\right)}^{n} - 1}}{i} \cdot \left(n \cdot \sqrt[3]{ {\left(\frac{i}{n} + 1\right)}^{n} - 1}\right)\right)\\ \mathbf{else}:\\ \;\;\;\;\frac{\sqrt[3]{i \cdot \frac{1}{2} + 1} \cdot \sqrt[3]{i \cdot \frac{1}{2} + 1}}{\frac{\sqrt{\frac{i}{n}}}{100}} \cdot \frac{\sqrt[3]{i \cdot \frac{1}{2} + 1}}{\frac{\sqrt{\frac{i}{n}}}{i}}\\ \end{array}\]We can then combine all of these expressions and set it as the target for the compound interest formula. Running Herbie with this expression as the target gives us a target error of \(11.42\) bits, an improvement of \(5.98\) bits of error over herbie. This is a good target for improvements, but it should be noted that to reach this target, improvements will likely have to be made to both the regime inference and the expression generation.
Future Work
One of the things that we wanted to look at previously was the best possible partitioning that we could realistically achieve, as determined by a SVM. This is definitely something interesting that we might want to come back to, but for now, looking at how Herbie generates intermediate expressions seems like the best way forward, allowing us to explore why the best expressions at certain points aren’t being generated.
Part of the work on regime testing was getting the regime plots and regime percent improvement plots working for arbitrary expressions. As of the time of writing, both of these plots are generated on any expression with more than 1 variable, and a separate graph is generated for each pair of variables. For example, in an expression with 3 variables, a total of 6 graphs are generated: 3 for both the regime plot and 3 for the regime percent improvement plot. These graphs are saved in the individual test directories similarly to the error plots displayed on the website. Currently the baseline, herbie, oracle, and target regime scores are output on the last line of the debug.txt file, listed starting with Baseline error score:. This location is likely to change in the future and will likely be combined with other testing options in a single cohesive log, potentially being integrated into the Herbie reports page.
Reproducing Results
All results were generated using the regime-testing branch of Herbie, commit 86b84ef2c54ef174fbb988bf9846dfd069559a45. To run all of the compound interest formula expressions, you can use this FPCore and run it with herbie report.